

Every business runs marketing across channels that report in different units. GA4 gives you sessions and key events. Meta gives you reach and engagement. The shop floor gives you foot traffic. The owner or the board asks one question: is marketing working better or worse than last month? You cannot answer that by adding the numbers together.
This post explains a simple method we have used with clients for years to combine any set of channel metrics into one trendable score, which we call the Marketing Metric. The maths has not changed since we first published it. The tools feeding it have: Universal Analytics is gone, Data Studio is Looker Studio, and GA4 calls conversions key events. The method below is updated for that, with a few caveats we have learned the hard way.
Three steps:
- Scale every metric onto the same 0 to 1 range.
- Weight each metric by how much it matters to you.
- Add the scaled, weighted values for each period to get the Marketing Metric.
Why you cannot just add up traffic sources
Say you run marketing for an electronics retailer with three signals you care about (in practice you will have more):
- Foot traffic: visitors counted at the store door.
- Social engagement: reactions, comments, shares and link clicks on your Meta posts, from Meta Business Suite Insights.
- Website sessions: from GA4.
Five months of data, with a naive total on the right:
| Real values | Foot traffic | Social engagement | Website sessions | Total |
|---|---|---|---|---|
| Jan | 34,000 | 258 | 1,320 | 35,578 |
| Feb | 20,000 | 148 | 1,079 | 21,227 |
| Mar | 22,000 | 404 | 1,175 | 23,579 |
| Apr | 20,000 | 531 | 1,227 | 21,758 |
| May | 19,000 | 70 | 1,263 | 20,333 |
The total is just foot traffic with noise. Social engagement nearly tripled from February to March and the total barely moved, because 20,000 door counts drown out 400 reactions. Whatever metric has the biggest raw numbers will always dominate a straight sum. That is why it does not work.
Step 1: Scale each metric to the same range
Put every metric on a 0 to 1 scale so they can be compared. The simplest way is min-max scaling: within each column, the highest month becomes 1, the lowest becomes 0, and everything else lands in between.
The formula for any value x in a column is:
scaled = (x - min) / (max - min)
In plain words: take this month's figure, subtract the lowest month in the column, then divide by the gap between the highest and lowest month. Do this separately for each metric.
In Google Sheets or Excel, with foot traffic in column A and the current month in A2:
=(A2-MIN($A$2:$A$13))/(MAX($A$2:$A$13)-MIN($A$2:$A$13))
Fill it down, then repeat for each column with its own range. Here are the real values again, followed by the scaled version:
| Scaled | Foot traffic | Social engagement | Website sessions |
|---|---|---|---|
| Jan | 1.00 | 0.41 | 1.00 |
| Feb | 0.07 | 0.17 | 0.00 |
| Mar | 0.20 | 0.72 | 0.40 |
| Apr | 0.07 | 1.00 | 0.61 |
| May | 0.00 | 0.00 | 0.76 |
Read down each column. January had the most foot traffic, so it is 1.00. May had the least, so it is 0.00. The same applies to the other columns independently.
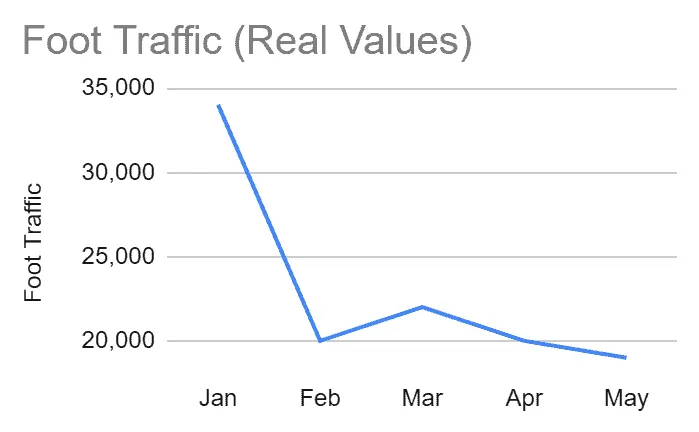
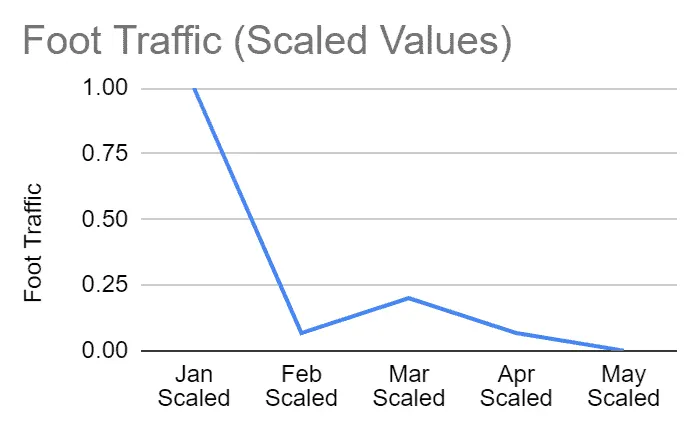
Scaling changes the units but keeps the shape. The month-to-month movement inside each column is preserved, which is what you care about. The two charts below plot foot traffic before and after scaling. Same line, different axis.
A caveat on min-max scaling
The scale is defined by the best and worst month in your range. When a new record month arrives, every historic scaled value shifts. That is fine for a one-off analysis and annoying for a live dashboard. Two fixes:
- Fix the window. Scale against a trailing 12 or 24 months and state it on the report.
- Use z-scores instead: subtract the column average and divide by its standard deviation (
=STANDARDIZE(A2, AVERAGE(A$2:A$13), STDEV(A$2:A$13))in Sheets). Values are no longer 0 to 1, but a single outlier month will not squash everything else.
Either way, document the choice. The method only works if the people reading the number trust that it is calculated the same way every month.
Step 2: Apply weightings
With everything scaled, you could add the columns and get a usable score where every metric counts equally:
| Scaled | Foot traffic | Social engagement | Website sessions | Total |
|---|---|---|---|---|
| Jan | 1.00 | 0.41 | 1.00 | 2.41 |
| Feb | 0.07 | 0.17 | 0.00 | 0.24 |
| Mar | 0.20 | 0.72 | 0.40 | 1.32 |
| Apr | 0.07 | 1.00 | 0.61 | 1.68 |
| May | 0.00 | 0.00 | 0.76 | 0.76 |
Already far better than raw totals. But you probably do not value a Facebook reaction the same as a person walking into the store. Weighting fixes that. Decide what share of the overall score each metric deserves, making sure the weights add up to 100%. For the retailer:
- Foot traffic: 50%
- Social engagement: 25%
- Website sessions: 25%
Multiply each scaled value by its weight:
| Weighted | Foot traffic (0.5) | Social engagement (0.25) | Website sessions (0.25) |
|---|---|---|---|
| Jan | 0.50 | 0.10 | 0.25 |
| Feb | 0.03 | 0.04 | 0.00 |
| Mar | 0.10 | 0.18 | 0.10 |
| Apr | 0.03 | 0.25 | 0.15 |
| May | 0.00 | 0.00 | 0.19 |
How do you choose the weights? Start with the metric closest to revenue and work back. If you have GA4 key events or store sales tied to each channel, weight by their historical contribution. If you don't, agree the weights with whoever reads the report, write them down, and don't change them without saying so. A score whose weights move every month is a score nobody will believe.
Step 3: Calculate the Marketing Metric
Add each row. The sum of the weighted values for a month is the Marketing Metric for that month.
| Weighted | Foot traffic (0.5) | Social engagement (0.25) | Website sessions (0.25) | Marketing Metric |
|---|---|---|---|---|
| Jan | 0.50 | 0.10 | 0.25 | 0.85 |
| Feb | 0.03 | 0.04 | 0.00 | 0.08 |
| Mar | 0.10 | 0.18 | 0.10 | 0.38 |
| Apr | 0.03 | 0.25 | 0.15 | 0.44 |
| May | 0.00 | 0.00 | 0.19 | 0.19 |
How to read the Marketing Metric
Because every input sits between 0 and 1 and the weights sum to 1, the Marketing Metric also sits between 0 and 1. Multiply by 100 if a score out of 100 reads better in a board pack. It usually does.
A single month's score means nothing on its own. "March was 0.38" tells nobody anything. The value is in the comparison: January was the strongest month in the period, February the weakest, and the score more than quadrupled from February to March. Plot it and the story is obvious.
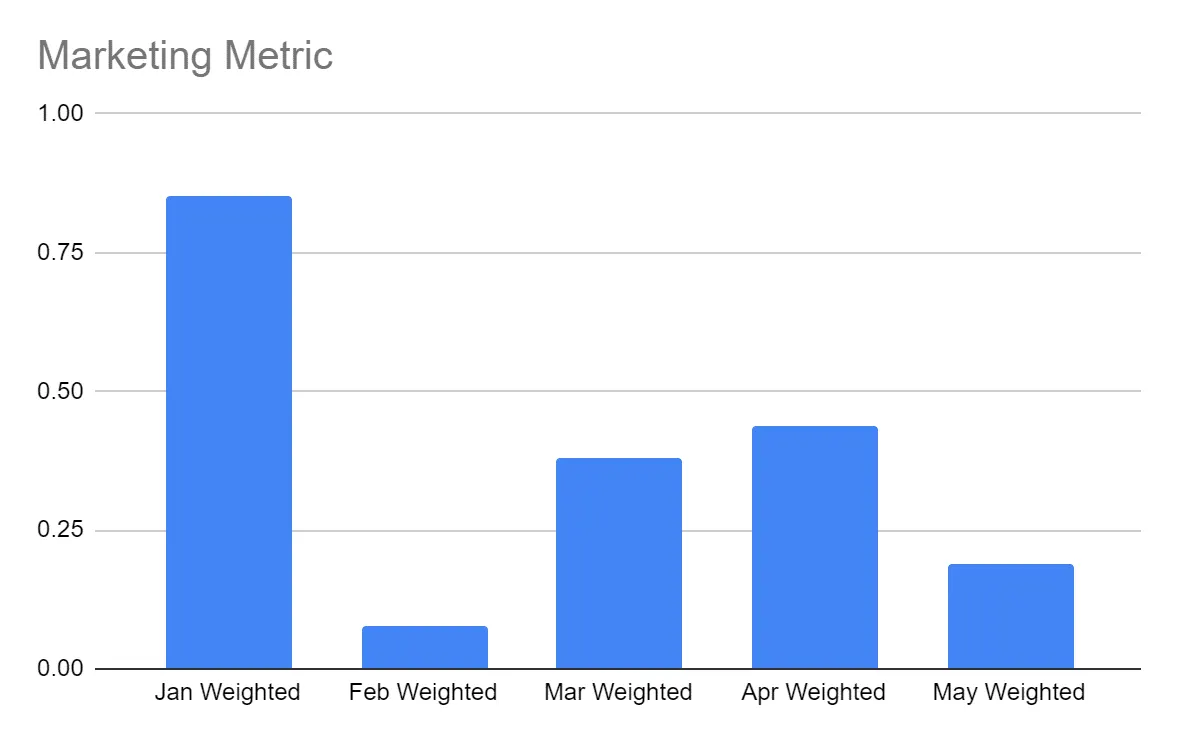
Use the headline score to spot the months worth asking about, then drill into the underlying metrics to find out which channel moved. April is a good example: foot traffic was flat, but social engagement hit its peak and web sessions were up, so the score rose. That is a more useful conversation than three separate reports.
Where the inputs come from in 2026
| Signal | Source | Metric to use |
|---|---|---|
| Website | GA4 | Sessions, or engaged sessions if you want to discount bounces |
| Website outcomes | GA4 | Key events (enquiries, purchases). GA4 renamed conversions to key events in 2024 |
| Organic search | Google Search Console | Clicks |
| Paid search | Google Ads | Clicks or conversions, not impressions |
| Social | Meta Business Suite, LinkedIn or TikTok analytics | Engagements or link clicks |
| Local presence | Google Business Profile performance | Calls, direction requests, website clicks |
| Your email platform | Clicks, not opens (Apple Mail Privacy Protection inflates opens) | |
| In store | Door counter or POS | Visitors or transactions |
Pick metrics that mean roughly the same thing across channels. Mixing an awareness metric like impressions with an outcome metric like purchases produces a score that is hard to explain. Engagement-level metrics (sessions, clicks, engagements, visits) combine well. Outcome metrics (key events, sales) combine well with each other. Keep the two groups in separate scores if you need both.
Presenting it
Build it in Google Sheets, connect the sheet to Looker Studio and chart the Marketing Metric over time at the top of the page, with the real values for each input charted underneath. Executives read the top line; the team reads the rest. We compared the options in static reports versus Looker Studio and the conclusion still holds: a live dashboard that is always the same shape beats a monthly deck. Our Looker Studio reporting work for clients usually starts with exactly this kind of composite score.
A note on attribution modelling
The Marketing Metric is a crude attribution model. You assign a weight to each channel and treat each one as if it operates alone. It ignores the customer who sees a Meta ad, searches your brand, visits the site twice and then walks into the store. For measuring overall engagement that is acceptable, because every one of those touches counts as engagement.
For attributing sales, use the tools built for it. GA4 uses data-driven attribution by default and lets you compare it with last click in the Attribution reports under Advertising. Google Ads and Meta each run their own attribution inside their platforms, and they will each claim the same sale, so never add platform-reported conversions together. Meta's standalone Attribution tool was retired in 2021, and Universal Analytics, with its old model comparison tool, was switched off in 2024. If you need something closer to the truth across channels, incrementality tests and marketing mix modelling are the current answers, and they are a separate project.
The Marketing Metric is not that. It is a half-day build in a spreadsheet that gives a busy owner one honest trend line. For most small and mid-sized businesses, that is a bigger step forward than any attribution model they will not read.